The Hidden Cost of Living in Two Currencies
Exchange rates silently eat your budget when you earn in one currency and spend in another. Here's how to see exactly what they cost you.
You get paid in dollars. You pay rent in euros. You buy groceries in the local currency. At the end of the month, your budget says you spent less than you earned — but your bank balance tells a different story. It dropped more than it should have.
You double-check the transactions. Nothing looks wrong. Every purchase is accounted for, every number matches. So where did the money go?
Exchange rates moved. Between the day you got paid and the day you paid rent, the euro got a little more expensive. Between that grocery run on the 5th and the one on the 25th, the rate shifted again. Each swing was small — barely noticeable on any single transaction. But added together, they quietly took a piece of your paycheck.
No one told you. No app flagged it. No line item appeared in your budget. It just happened.
Why I built this: Tallyroot’s FX tracking exists because I watched it happen to my own money — months where I hadn’t changed my spending at all, but the rate moved and my real costs drifted by a few percent. No single transaction looks wrong, so it stays invisible until something adds it up. I wanted that “something” to exist.
The invisible tax
If you live and work across two or more currencies, exchange rate movements are a constant, silent cost. They compound in ways that are hard to see — and even harder to track. (If you’re new to multi-currency envelope budgeting, start there — this post covers what happens next.)
Your budgeting app treats 100 USD as 100 USD, whether you converted it at 0.92 EUR or 0.88 EUR. Your bank shows the converted amount after the fact, but never tells you what the rate was or how it compared to last week. There’s no line item for “lost €47 to exchange rate movement this month.” It just vanishes.
Over a year, a 3-5% swing in your spending currency adds up. If you’re earning $5,000/month and spending in euros, a 4% unfavorable shift means roughly $200/month — $2,400/year — that silently disappeared from your purchasing power. Not because you overspent. Because the rate moved.
This isn’t a trading problem. You’re not speculating on currencies. It’s a visibility problem: the information exists, but nothing shows it to you.
What you’re doing instead
Most people dealing with multiple currencies have some version of the same routine.
You check Google or XE before a big purchase to see “the current rate.” You keep a rough mental model of what the rate was when you got paid. Maybe you run a spreadsheet that converts everything at one fixed rate per month — close enough, you figure.
Or you just ignore it. You accept that some months the numbers won’t quite add up, and you move on. The gap is small enough to shrug at. Until it isn’t.
The problem isn’t your discipline — you’re already tracking every transaction. The problem is that no tool shows you what exchange rates are actually doing to your budget. Most multi-currency budget apps stop at converting transactions — they never surface the rate impact itself. You’re left guessing, estimating, or pretending it doesn’t matter.
What it looks like when you can actually see it
Tallyroot’s FX Intelligence makes exchange rate impact visible — automatically, across every currency you use. It builds on the same multi-currency transaction tracking that handles your day-to-day conversions. Here’s what that looks like in practice.
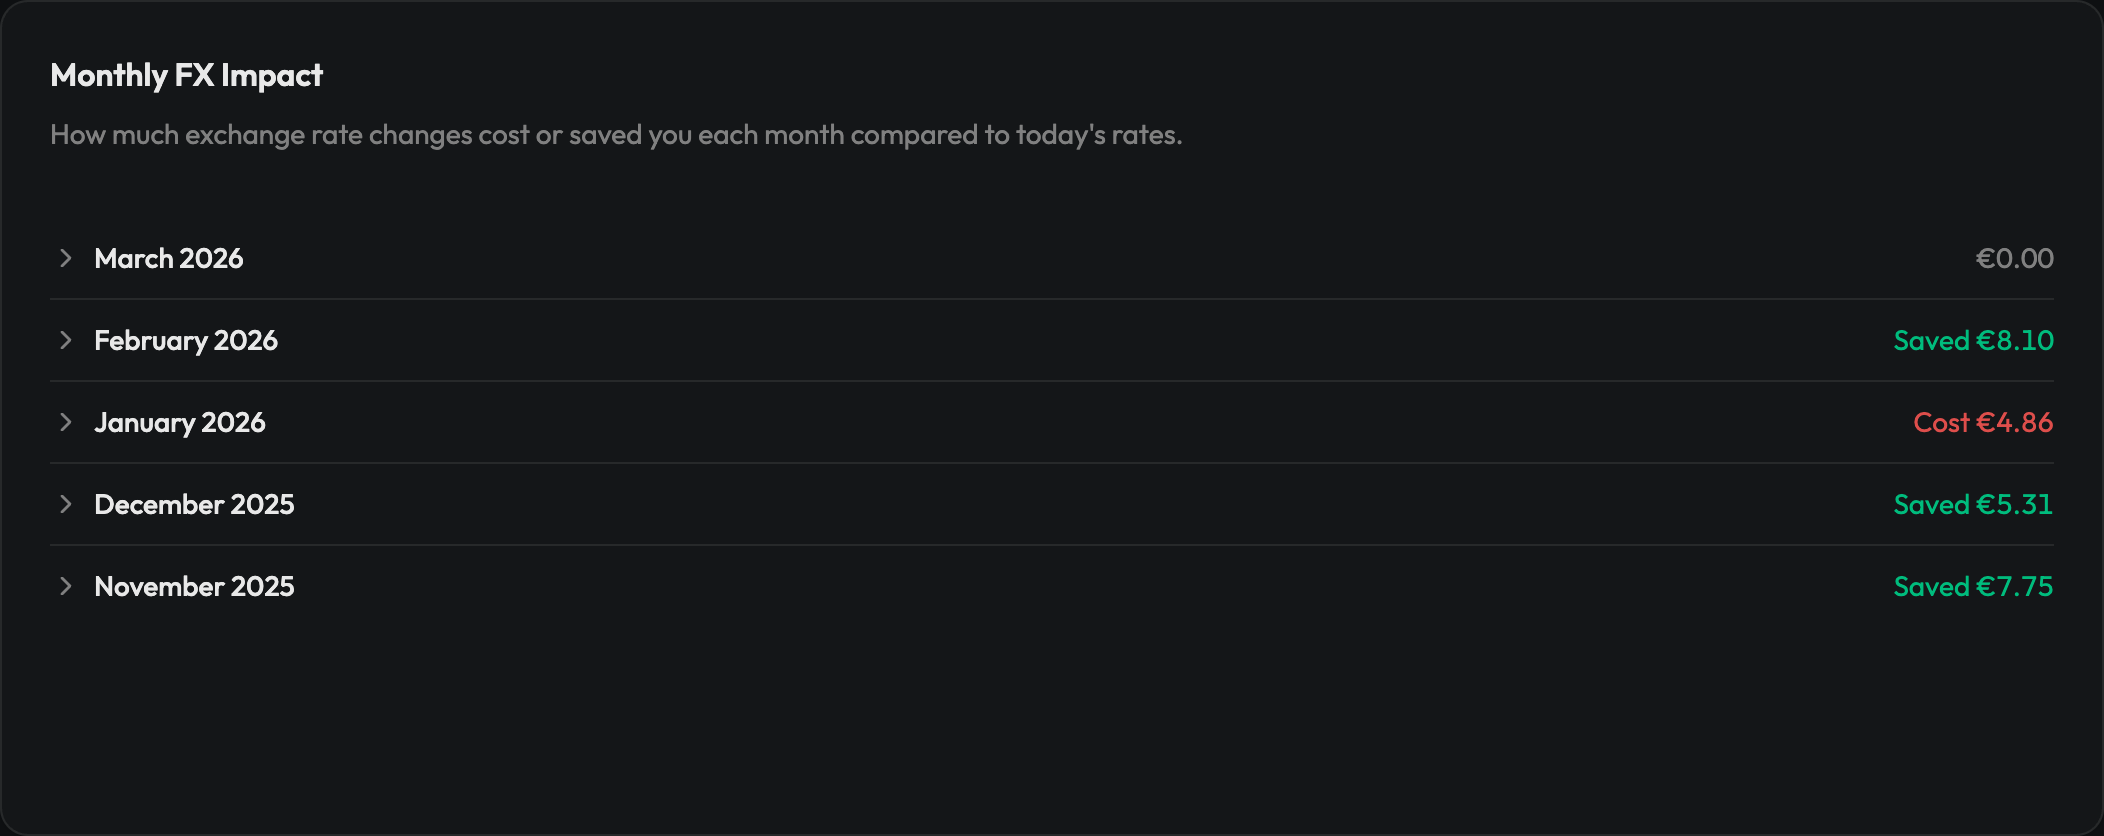
Monthly FX impact
A table showing exactly how much exchange rates cost you or saved you each month, broken down by currency pair. No spreadsheets, no manual rate lookups. You can see at a glance that EUR/USD cost you €32 in March but saved you €18 in April.
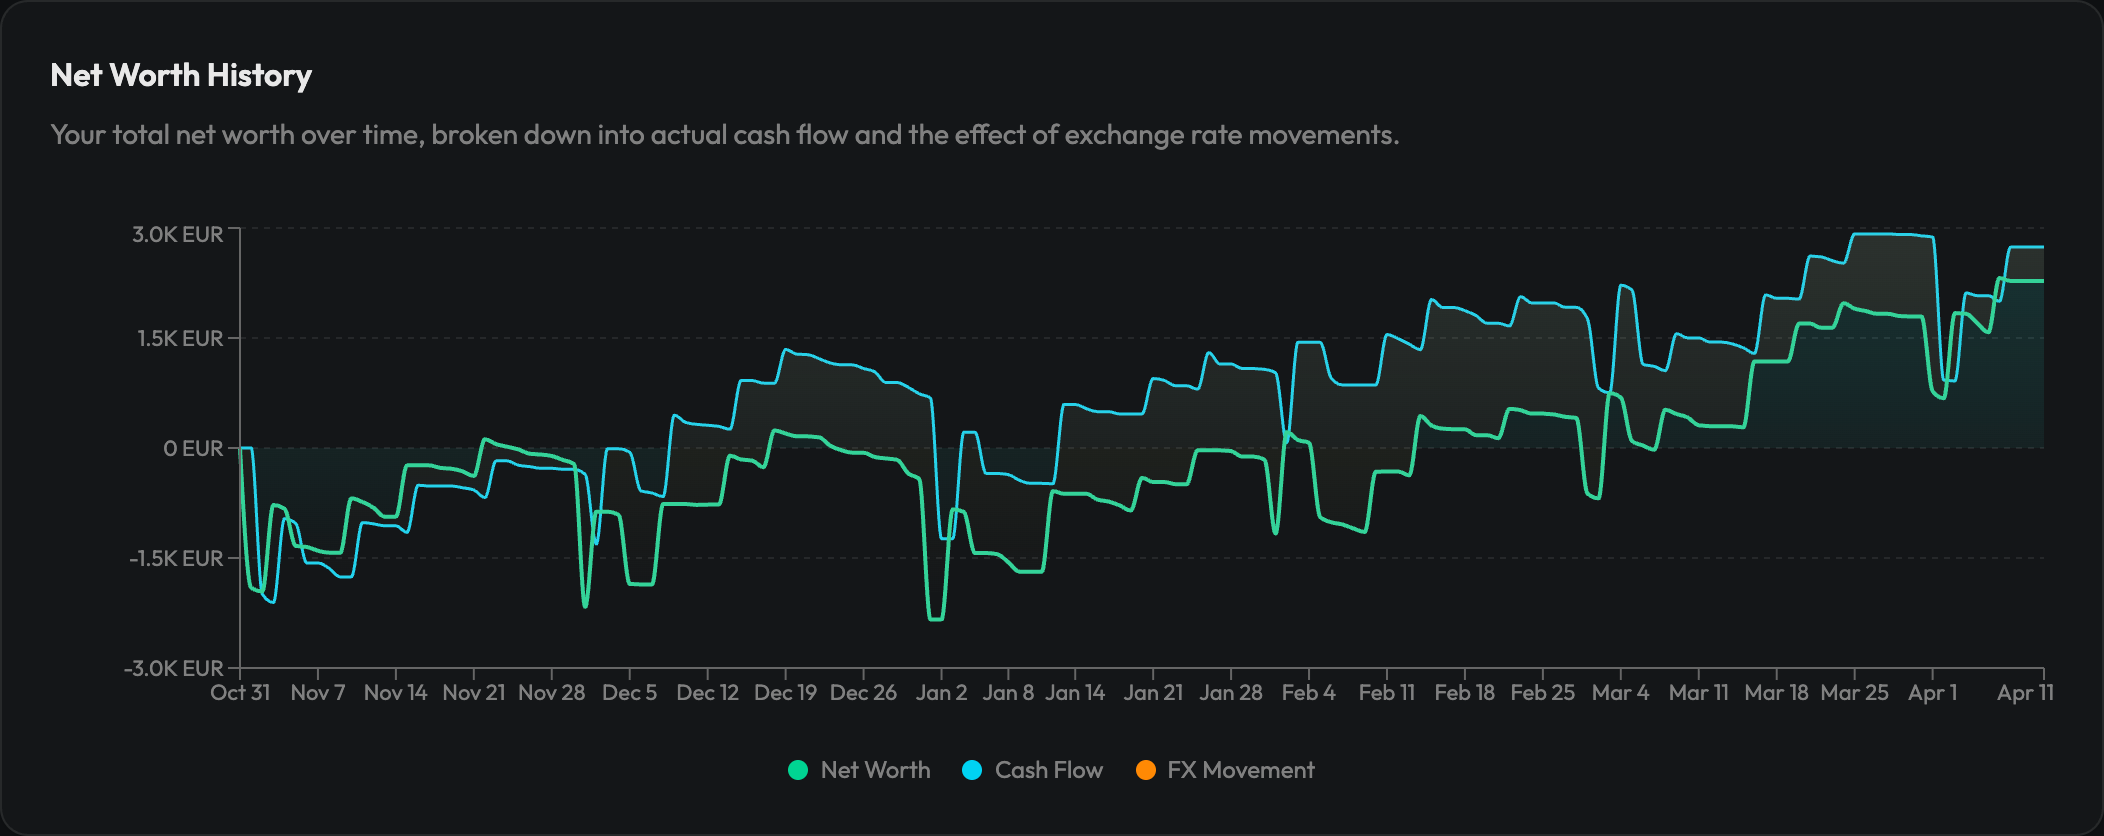
Net worth decomposition
Your net worth went up €500 this month. Great — but was that because you actually saved money, or because one of your currencies strengthened? This chart decomposes the answer, separating real cash flow from FX movement. You’ll know whether your savings are working for you, or whether you just got lucky on rates.
Rate sparklines
The currency pairs that matter to you, at a glance. Current rate, six-month trend, percentage change. No need to open another tab or check a finance site — the rates you actually care about are right there, updated daily.

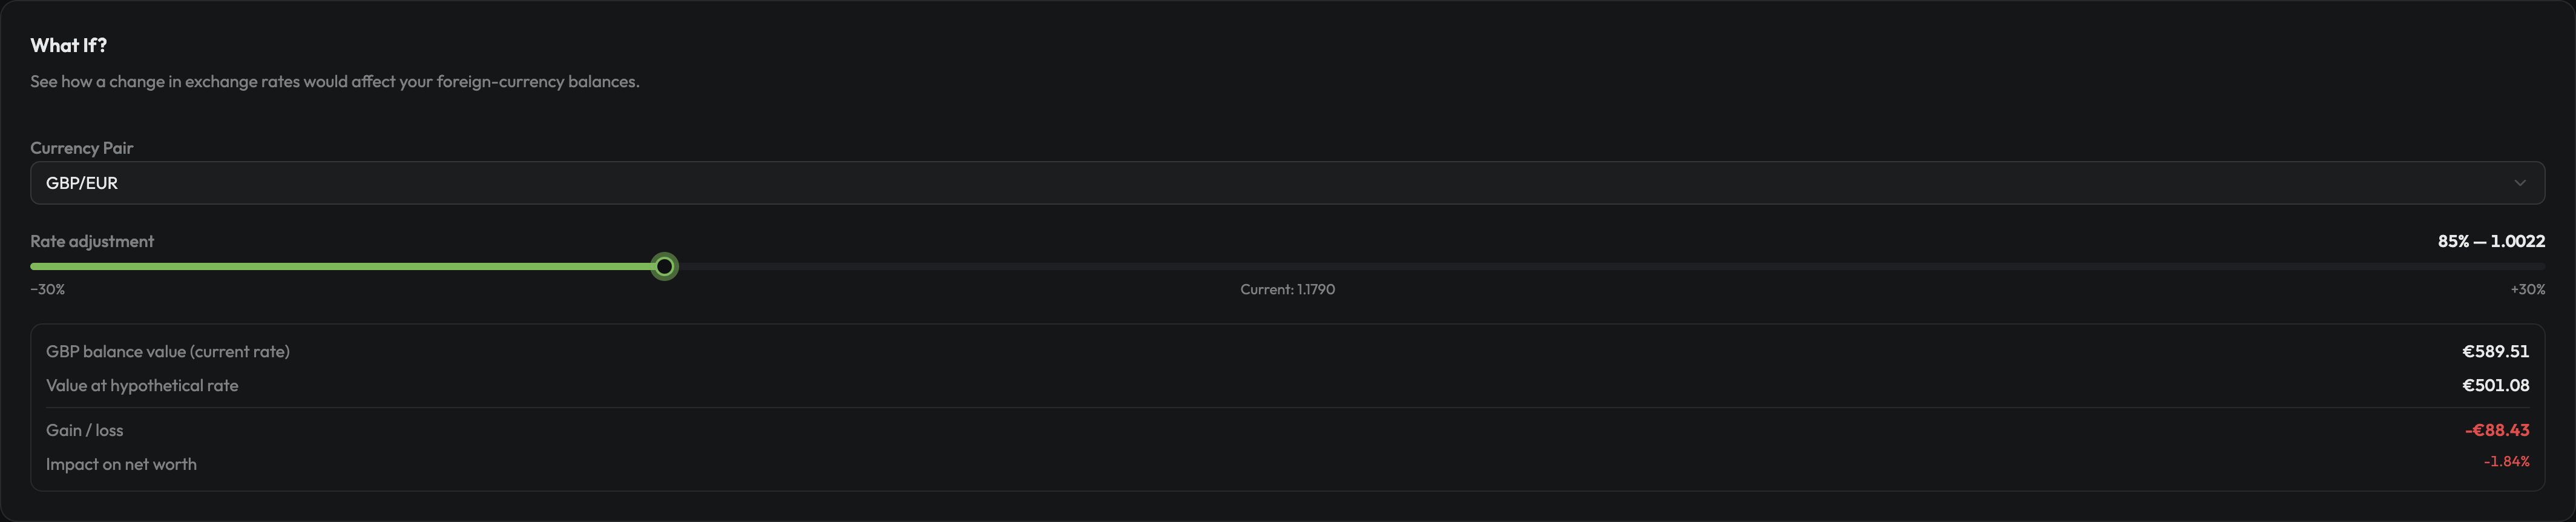
Scenario planning
What if EUR/HUF drops 5%? What if the dollar weakens against the pound? Slide the bar and see how it would affect your balances instantly. It’s not a forecasting tool — it’s a simple “what if” calculator that helps you understand your exposure before it becomes a surprise.
Why this matters more than you think
Seeing your FX impact changes how you make financial decisions.
When you know that EUR/USD has been moving against you all month, you can time a large transfer for a better day instead of converting on autopilot. When you can see which account has the most rate exposure, you can choose to spend from the less volatile one. When your budget comes up short, you can look at the FX impact table and know whether it was overspending or rate movement — and stop blaming yourself for a gap that was never your fault.
It’s not about becoming a currency trader. It’s about having the same visibility into exchange rates that you already have into your spending categories. Your budget deserves the full picture.